|
About D2Check Values at the Protein
and Residue Levels
As the field of proteomics advances with an increasing number of measured and proposed protein sequences and structures, the validation and interpretation of said structures becomes increasingly important. The urgent need for scoring functions arises, not only from the more latent need to verify experimentally derived structures, but also from the increasing use of de novo and homology computer models constructed from known sequence. While several useful scores exist, this site provides yet another tool to help the community.
The dihedral angle distribution within a protein structure remains
an important aspect in approaching this problem. So called Ramachandran
plots, which evaluate the &Phi - &Psi values of each
in any given protein structure,
for example, have been widely used in protein validation
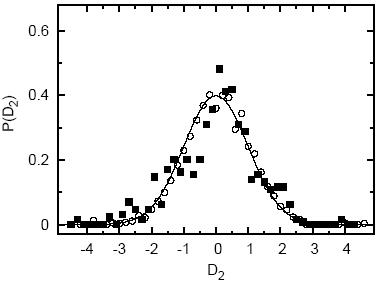
research. B Based on this observation , a new checking function recently suggested by Hernandez et al., uses the aforementioned dihedral angle correlations to evaluate the degree of structural compatibility of a given structure with the nonredundant set of proteins deposited in the Protein Data Bank (PDB). The analysis is based upon standard entropic functions rooted in information theory and gives rise to the so-called D1 and D2 values. These checks serve to extend the substantial understanding that has already been gained using dihedral angle analysis. This web site, called D2CheckServer automates the process for obtaining D2Check values. Given a PDB ID or user-provided PDB file, it calculates and displays the associated &Phi - &Psi (i.e. Ramachandran) and &Psii-&Phii+1 plots. Using this information the server proceeds to calculate the D2Check value and the results are presented in two complementary forms. First, the D2Check value averaged over the entire protein is displayed with respect to the distribution of all proteins sampled in the PDB. The value is defined such that it simply represents the standard deviation from the mean of the distribution of proteins in the PDB. Therefore, larger D2Check values indicate that a given protein is increasingly dissimilar to the ensemble of structures in the PDB. To further aid in the analysis, a more detailed representation that assigns D2Check values at the residue level are also presented in the form of a convenient color strip. In this manner, it becomes easy to locate ``interesting'' sites of the given protein. For more details on the construction and interpretation of D2Check, please refer to our recent publication on the subject. Using D2Check you will have access to both the &Phi - &Psi and &Psi - &Phi values and plots for any user-defined or existing protein structure in the PDB. Likewise you will have access to the D2 score of that particular structure providing a measure of how reasonable the structure is with respect to the PDB as measured by the new entropic checking function. The overall distibution of D2 for all the structures in PDB is given below:
|
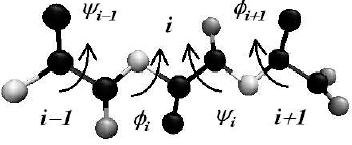 eyond
the correlations in the internal &Phi and &Psi values of one residue,
the correlations in
the &Psii-&Phii+1 values between adjacent
amino acids have been seen to also play an
important role in dihedral angle analysis.
eyond
the correlations in the internal &Phi and &Psi values of one residue,
the correlations in
the &Psii-&Phii+1 values between adjacent
amino acids have been seen to also play an
important role in dihedral angle analysis.